TL;DR
- Most Salesforce SI partners target 35 to 40% gross margins, but consistently deliver 18 to 25% after scope creep, rework, and discovery overruns erode the gap. The pattern holds across engagement types, team sizes, and geographies
- SPI Research’s 2025 Professional Services Maturity Benchmark (covering 403 firms) found that industry EBITDA fell to 9.8% in 2024 from 15.4% in 2023, billable utilization dropped to 68.9%, and on-time delivery fell to 73.4%. These are not outlier numbers. They are the median
- Utilization optimization and offshore ratios have a mathematical ceiling. Pushing past 82% utilization creates burnout and attrition. Indian Salesforce developer rates have risen 40 to 60% over five years, compressing whatever rate arbitrage remained
- The three biggest margin killers are incomplete discovery, design rework from poor inputs, and the metadata blind spot in complex brownfield orgs. A single missed automation conflict in a complex org generates 80 to 120 hours of unplanned rework
You target 40% gross margin on Salesforce implementations. You land somewhere around 22%. You have pushed utilization past 78%, shifted delivery offshore, and tightened scoping processes. The gap persists.
This piece is not about Salesforce’s corporate profitability. Their non-GAAP operating margin sits above 32% as of FY2026, and they optimize it relentlessly every quarter. This is about your profitability as the consulting partner delivering Salesforce to enterprise clients. The core argument is straightforward: most Salesforce SI partners bleed margin not because they price poorly or staff inefficiently, but because the delivery operating model itself, built on manual discovery, human-dependent design, and sequential development, cannot scale without proportional cost increases. The fix is not hiring better, billing higher, or offshoring harder. It is re-architecting how delivery works. What follows is the diagnosis we wish someone had given us earlier, along with the math behind what happens when you stop optimizing within a broken model and start changing the model itself.
The Uncomfortable Math Behind Salesforce Delivery Margins
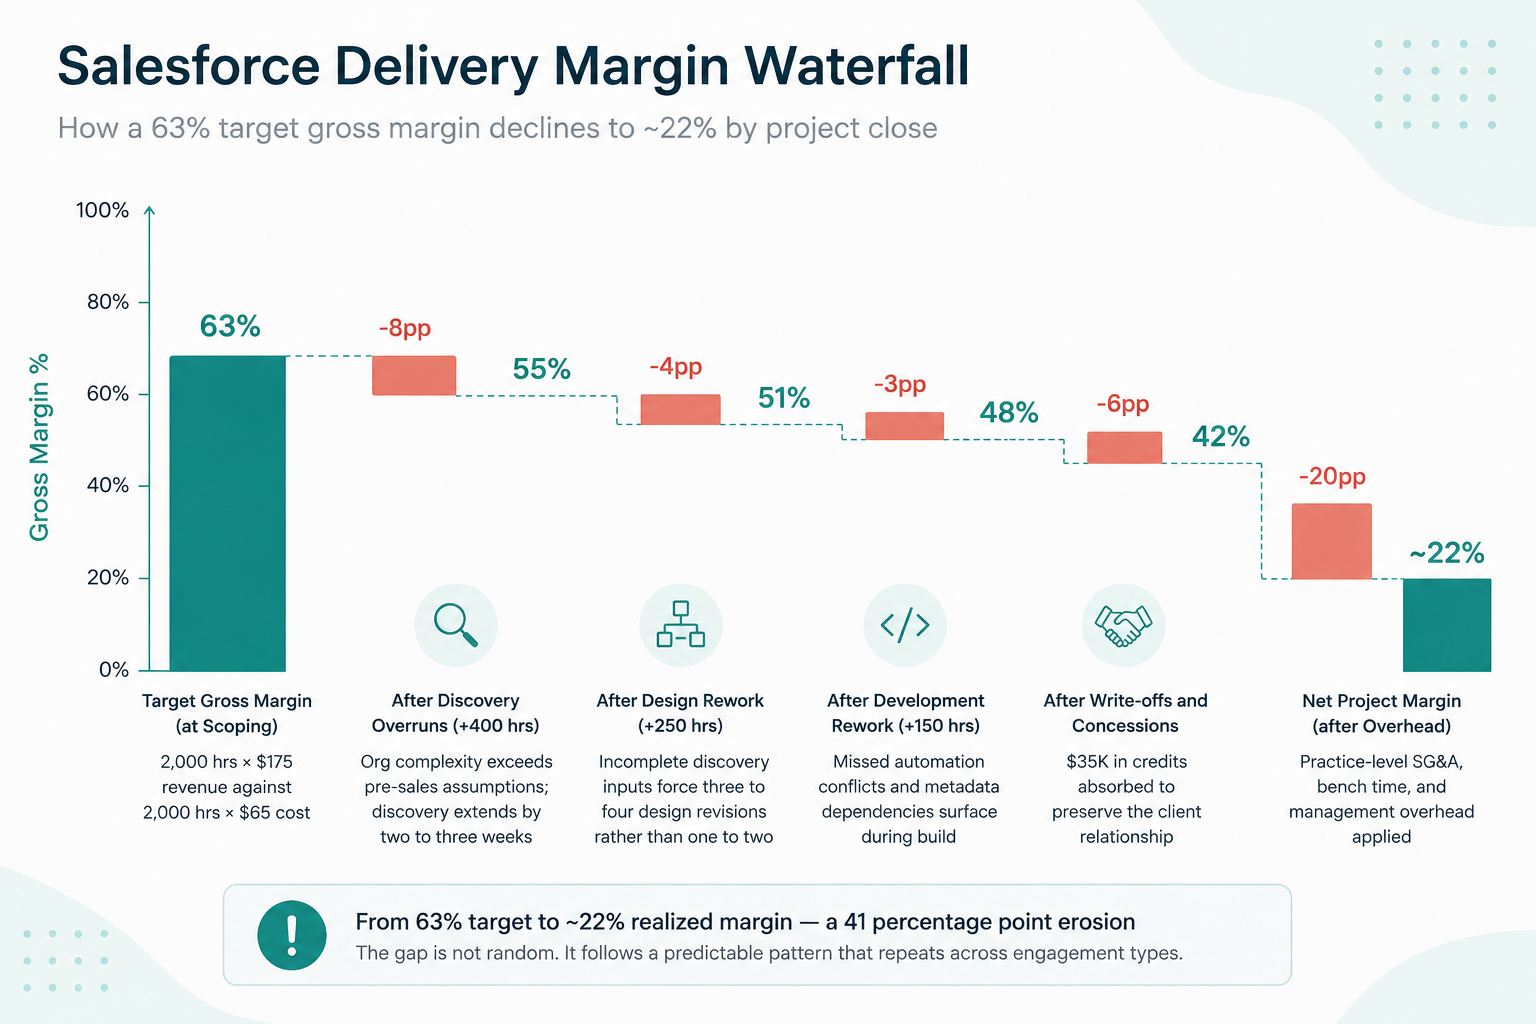
A typical Salesforce implementation project looks healthy at scoping. By the time the engagement closes, the margin waterfall tells a different story. The gap between target and actual is not random. It follows a predictable pattern that repeats across engagement types.
Walk through a project P&L that every delivery leader will recognize. You scope a Sales Cloud and Service Cloud implementation at 2,000 hours. Your blended bill rate is $175 per hour. Your blended loaded cost rate, covering salary, benefits, tools, and overhead allocation, is $65 per hour. On paper, that is 63% gross margin.
Here is what actually happens:
Discovery takes longer than planned because the client’s org is more complex than the pre-sales team assumed. Automation conflicts surface during development that nobody caught during discovery. The design goes through four revision cycles rather than two. QA uncovers configuration issues rooted in incomplete requirements. Your 2,000-hour project balloons to 2,800 hours. You absorb 800 hours of unplanned work you cannot bill, then give $35K in credits to preserve the client relationship.
For a line-by-line breakdown of where those dollars actually go, our analysis of typical costs for Salesforce implementation traces each category from scoping through deployment.
SPI Research’s 2025 Professional Services Maturity Benchmark, covering 403 firms across IT consulting and professional services, found that industry EBITDA fell to 9.8% in 2024 from 15.4% the prior year, the lowest in five years. On-time delivery dropped to 73.4%. Billable utilization fell to 68.9%, below the 75% threshold SPI identifies as optimal. These are not Salesforce-specific numbers, but they reflect the same structural pressures that every SI partner feels at the project level. The gap between median and top-quartile performance is not explained by billing rates or headcount. It is explained by how efficiently those firms convert scoped hours into delivered value.
Why Utilization Rates and Offshore Ratios Hit a Ceiling
Every mature SI partner has already pulled the two most obvious margin levers. Both have a ceiling that most delivery leaders feel intuitively, even when leadership keeps pushing for more. Understanding why that ceiling is real is the precondition for finding the fix that actually works.
Utilization optimization
Most mature Salesforce practices run at 75%-82% utilization, which aligns with broader professional services benchmarks that typically fall in the 70–80% range. Getting there from 65% is meaningful. Getting from 80% to 85% is a different equation, because each additional percentage point yields diminishing marginal returns. Past that threshold, firms begin to see second-order effects that do not show up in the current quarter: burnout, declining work quality, and increased attrition as sustained high utilization becomes unsustainable
Offshore and nearshore ratios
Shifting configuration work and development to India or Latin America, keeping architects and client-facing roles onshore, and pocketing the rate arbitrage was the margin play of the 2010s. The math worked for a decade. It is compressing now for two reasons. First, Indian Salesforce developer rates have risen by 40 to 60% over the past five years, according to Mason Frank salary survey data. Second, coordination overhead from time zone handoffs, context loss during developer rotations, and ramp time in complex orgs erodes whatever rate savings remain. A distributed delivery team managing a brownfield Revenue Cloud Advanced implementation across multiple time zones is not cheaper. It is slower and more error-prone, and the errors compound.
Both strategies were smart and necessary. They also have hard limits. They optimize within the existing delivery model instead of addressing why the model itself keeps eroding margins. Recognizing that ceiling is the first step toward the structural fix.
The Real Margin Killers: Discovery Gaps, Design Rework, and the Metadata Blind Spot
If utilization and offshore ratios define the ceiling, the floor is set by three specific delivery phases where margin disappears. These are not random failures. They follow from the same root cause: most Salesforce partners lack the tooling to fully understand a client’s org before they start designing for it.
Discovery gaps that compound downstream
Most discovery processes rely on stakeholder interviews, manual documentation, and whatever the previous admin or partner left behind, which is often incomplete or outdated. Consultants spend three to six weeks trying to understand the client’s current org, mapping objects, fields, automations, integrations, and business processes.
The problem is what they miss. Validation rules that conflict with planned automation. Record-Triggered Flows that fire in sequences nobody documented. Apex triggers with dependencies on custom objects are absent from any requirements document. Process Builders half-migrated to Flows. Permission set groups with overlapping access that create security gaps nobody surfaces until UAT. A single missed automation conflict in a complex Salesforce org generates 80 to 120 hours of unplanned rework, the equivalent of three weeks of a senior developer’s time, on work that was never scoped and cannot be billed.
Design rework that burns senior capacity
The design phase should be where your most expensive talent creates the highest-value deliverables. Instead, it frequently becomes an expensive correction mechanism for discovery failures. When discovery inputs are incomplete, architects design against an inaccurate picture of the org. They produce a solution design document, review it with the team, discover gaps, revise, discover more gaps, and revise again. Three to four iteration cycles are common on complex implementations.
Your architects are too expensive to spend rebuilding deliverables that upstream gaps invalidated. A solution architect at $200 per hour running three unnecessary revision cycles on a 40-hour design document costs $24,000 in unrecoverable time before a single line of configuration has been written.
The Metadata blind spot
This is the root cause of both problems above. Most partners lack tooling that provides a comprehensive, real-time view of a client’s org metadata before scoping begins. Every Flow, every Apex class, every validation rule, every custom object, every permission set, every integration endpoint: mapped, indexed, and searchable. Without that visibility, you are designing solutions on top of an org you only partially understand. You are building on assumptions rather than facts, and the gap between those assumptions and reality is where your margin goes. This is exactly why we built HighRev.ai: a multi-agent AI platform that reads and indexes Salesforce metadata across every object, field, Flow, and Apex class in an org, completing in hours what manual discovery takes weeks to approximate.
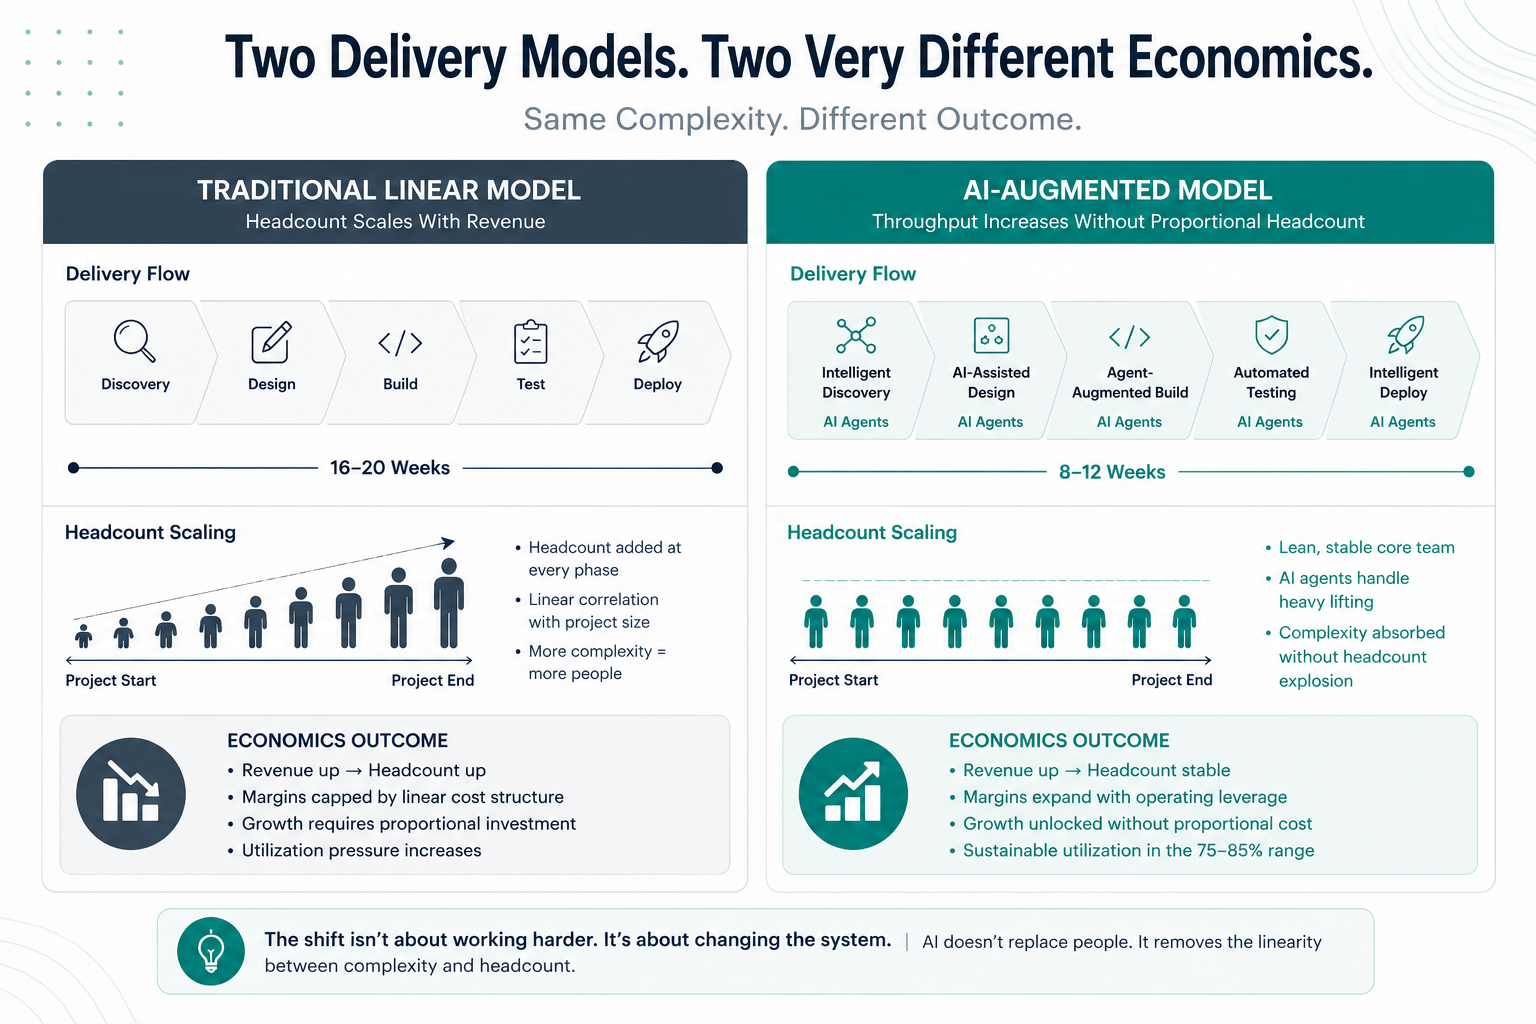
The Delivery Model Shift: From Linear Headcount to AI-Augmented Throughput
The delivery model most Salesforce partners operate today is linear: more projects require more people, which requires more cost. Revenue grows, but margins stay flat or decline because each new engagement requires a proportional increase in headcount. The structural fix is to change the model, not optimize within it.
The best-run delivery teams are beginning to layer AI agents into the repeatable, high-volume work across the delivery lifecycle, keeping experienced consultants focused on the work that actually requires human judgment, client relationships, and strategic thinking. For Salesforce delivery best practices in this context, the economics are clear: more projects should not require proportionally more people.
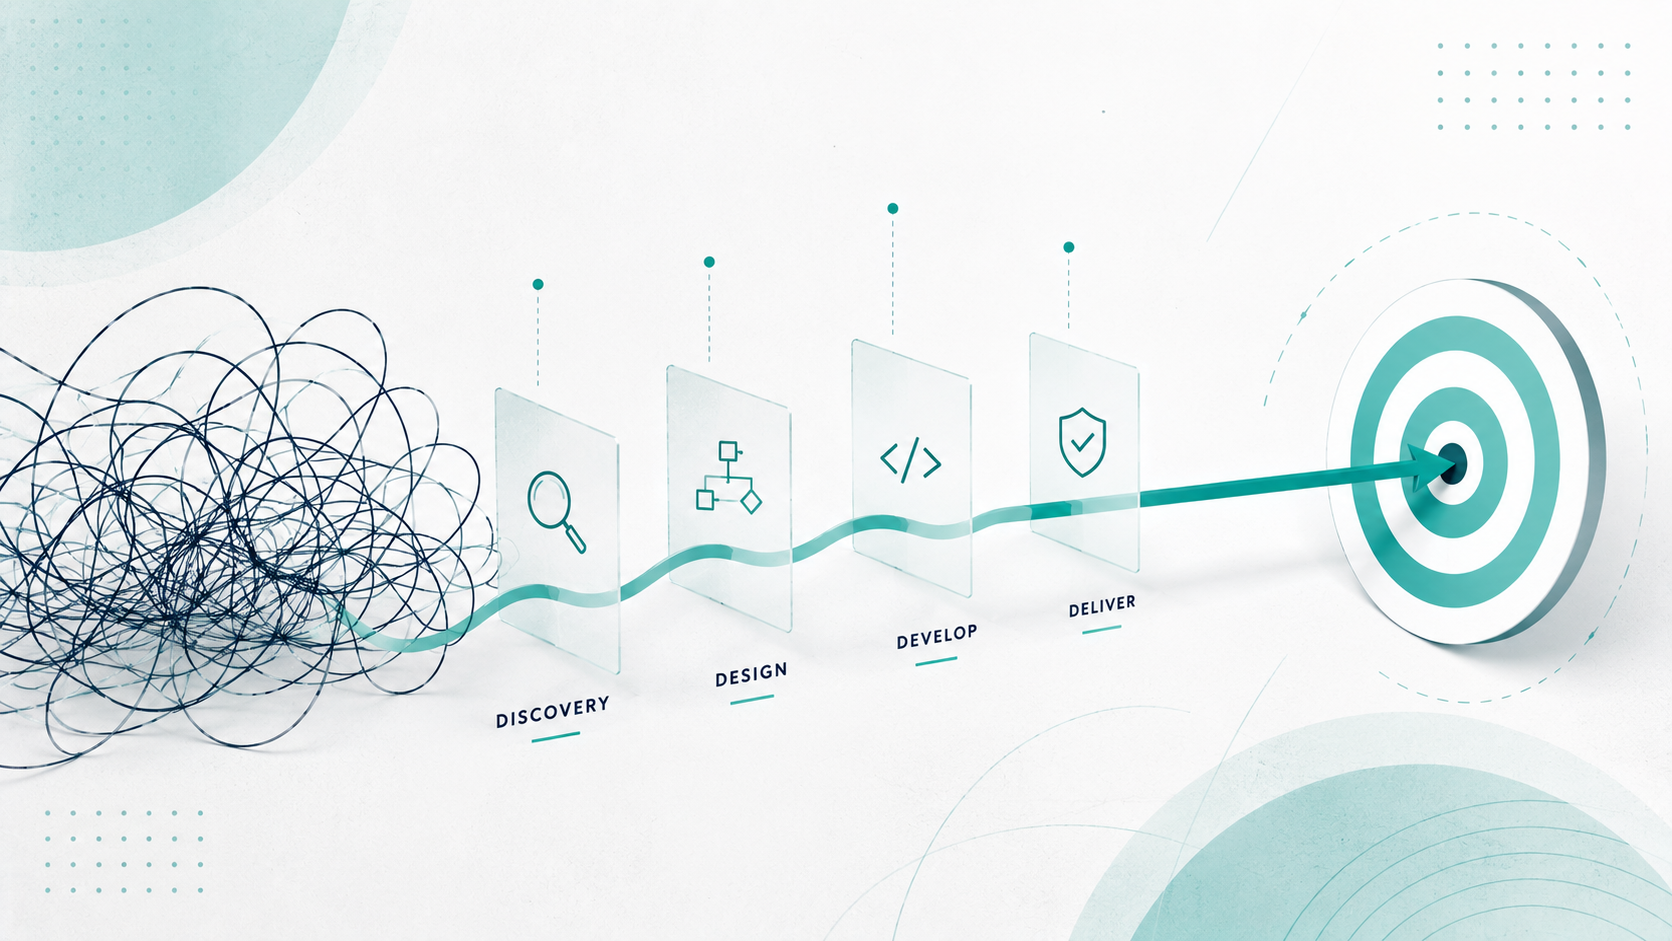
Discovery
AI agents ingest and analyze org metadata, mapping every object, field, automation, integration, and dependency in hours rather than weeks. The team gets a complete, searchable picture of the org before a single stakeholder interview. Those interviews shift from exploratory to targeted: you are validating a picture you already have, not building one from scratch.
Design
AI-assisted solution design accounts for the org’s existing architecture, identifies conflicts before configuration begins, and generates design artifacts that senior architects review and refine rather than build from a blank page. The architect’s time shifts from document production to design judgment. Three revision cycles become one, because the inputs were complete before the design started.
Development
Metadata-aware development generates configuration, Apex classes, Flows, and LWC components based on validated designs, with built-in understanding of the org’s existing structure. Deployments do not break existing functionality because the system knows what is already there. The distinction matters: platforms purpose-built for Salesforce delivery automation, using AI agents specialized in Salesforce metadata rather than generic code generators, augment the team by compressing manual phases. Generic AI tools produce generic output. Org-aware agents produce output validated against the specific org to which they will be deployed.
Margin Impact Model: What Changes When You Compress Discovery-to-Deployment
Arguments only matter if the numbers work. Instead of comparing abstract models, take a single project that most delivery leaders will recognize.
Earlier in this piece, we walked through how a typical 2,000-hour Salesforce implementation can expand to nearly 2,800 hours once discovery overruns, design rework, and downstream fixes accumulate: pushing margins from an expected 63% closer to the low-20% range after overhead.
Now change one variable: the efficiency of the front-end phases.
With a more complete view of the org during discovery and fewer design iterations, the same project can realistically land closer to 1,800-2,000 total hours, rather than 2,800. Discovery compresses from four to five weeks down to one to two. Design cycles are reduced from four rounds to one or two. The downstream rework never materializes because the upstream inputs were complete.
Revenue remains constant. Cost does not.
In that scenario, gross margins return to the 60%+ range, and net project margins settle closer to 35–40%, depending on overhead structure. The improvement is not driven by pricing, utilization, or offshore ratios. It comes from eliminating the rework that previously consumed 30–40% of total delivery effort.
The effect compounds at the practice level. A team that consistently delivers projects in 10–12 weeks instead of 16–20 weeks does not just improve margin. It increases capacity. The same team can take on more projects per year without proportional hiring, which is where margin expansion and revenue growth start to reinforce each other.
The key point is simple: compressing discovery and design does not just save time in those phases. It removes the downstream rework those gaps would have created, which is where most margin is actually lost.
What This Means for Salesforce Practice Leaders
The margin conversation is no longer about incremental optimization. It is about whether your delivery model is built for the next five years or the last five. Three strategic implications follow from the analysis above, and each one carries decisions that compound over time.
Competitive positioning
Partners who structurally lower their delivery costs have two options: compete on price, or maintain pricing and reinvest margin into client success, innovation, and talent. Both are viable strategies that become available when your delivery model is efficient. Neither is available when 20 percentage points of gross margin are being consumed by rework and overruns.
Partners who do not close the structural gap will face pressure from two directions simultaneously: AI-augmented competitors who can price more aggressively while protecting their margins, and enterprise procurement teams who are getting smarter about benchmarking implementation costs. That dual squeeze is already visible in deal cycles for mid-market Sales Cloud and Service Cloud work.
Talent strategy
AI-augmented delivery changes who you need to hire. Fewer junior consultants are performing repetitive configuration and documentation work. More mid-senior talent focused on solution architecture, change management, and client advisory. This shifts the cost structure in your favor: the work that commands premium billing rates and the work you are actually staffing for align more closely.
It also changes how you recruit. Top-tier Salesforce architects and senior consultants do not want to spend their careers on org archaeology and user story documentation. A practice that uses AI to eliminate that work and put senior talent on strategic problems is a more attractive place to work. In a talent market where demand for senior Salesforce professionals consistently outpaces supply, that recruiting advantage compounds quickly.
Scalability
Growing revenue without proportionally growing headcount is the strategic objective that every practice leader articulates, and almost nobody achieves. The linear delivery model structurally prevents it. AI-augmented delivery is the first mechanism that makes it tractable. A 60-person practice delivering the throughput of an 85-person practice is not a hypothetical. It is the arithmetic consequence of compressing three delivery phases that currently consume 40% of project hours in rework and overruns.
The compounding effect across the portfolio is what makes this a strategic investment rather than a productivity tool. Each engagement where AI-augmented discovery produces a complete org picture before design begins reduces the probability of rework on that engagement and improves the pattern recognition that informs every subsequent one.
The Path Forward: Moving from Margin Pressure to Margin Advantage
The diagnosis is clear. The path forward is practical and specific. Four steps provide any practice leader with a starting framework that does not require a full platform evaluation to produce useful data.
Step 1: Audit your margin leakage by phase
Track actual versus estimated hours by delivery phase: discovery, design, development, QA, and deployment. Most Salesforce practices track project-level margin but not phase-level contribution to overruns. Without phase-level data, you cannot identify which phase is driving the gap, and you end up applying pressure broadly rather than solving the specific problem.
Pull three to five recent engagements. For each one, ask: where did the hours exceed the estimate, and what caused the overrun? In most practices, discovery and design account for 60 to 70% of the total overrun, even though they represent 30 to 40% of the scoped hours. That asymmetry tells you where the structural fix has the highest leverage.
Step 2: Identify your highest-rework phases
Scope creep originates almost always from incomplete discovery or metadata blind spots. The mid-build requirement change that costs three weeks is not a project management failure in isolation. It is a discovery failure that deferred its cost to the most expensive point in the engagement. Knowing this changes where you invest: better discovery inputs at the start of a project have a multiplier effect on every phase that follows.
Step 3: Evaluate AI-native delivery tooling
DevOps tools, CI/CD pipelines, and deployment automation solve a real problem: the last mile of delivery. They do not address the front end of the delivery lifecycle, where most margin leakage originates. Look for platforms that address discovery, org analysis, design automation, and metadata-aware development. The evaluation question is not whether the platform does AI. It is whether the AI understands Salesforce metadata natively: objects, fields, Flows, Apex classes, permission models, and their dependencies. Generic AI tools that generate Salesforce code without org context produce output that requires as much manual adaptation as starting from scratch.
Step 4: Pilot on a single project type
Pick a mid-complexity Sales Cloud or Service Cloud implementation. Run AI-augmented discovery and design in parallel with your standard process on a single live engagement to enable a direct comparison. Measure three things: hours saved in discovery, reduction in design iteration cycles, and capacity freed for the development phase. Once you have numbers from a single pilot, the practice-level math becomes straightforward. At HighRev.ai, we built a multi-agent AI platform for exactly this: automating discovery, design, and development for Salesforce consulting partners who are serious about improving structural margin.
Schedule a HighRev.ai demo, and we will show you what this looks like on a real org.